Turn IP traffic into named relationships
Map hosts, networks, groups and services so an investigation starts with assets your team recognizes, not anonymous addresses.
obserae turns NetFlow and IPFIX into a practical NDR: named assets, intended connectivity, suspicious sessions, and searchable evidence. Start with the flow records your infrastructure already exports, then see what is normal, what changed, and what needs an investigation.
Free Community edition · Local install · No telemetry
The first value is clarity. You do not need another wall of flow logs; you need to know which conversations exist, whether they are expected, and what to do with the ones that are not.
Map hosts, networks, groups and services so an investigation starts with assets your team recognizes, not anonymous addresses.
Describe what should be allowed in the Flow Matrix. Every session can then be matched against the architecture you meant to run.
Unexpected east-west traffic, known-bad destinations, cloud outliers, scans and volume spikes become leads you can review.
Deploy on your own host, keep the data local, export configuration as YAML, and evaluate without a cloud dependency.
NetFlow tells you where packets went. obserae adds the context an operator needs to decide whether the session belongs in the environment.
10.10.42.18 → 10.20.4.11:5432 TCPA useful evaluation should be simple: collect flows, name what matters, compare traffic to intent, then investigate the exceptions.
Receive NetFlow v5/v9 and IPFIX from routers, firewalls, virtual switches or host probes.
Describe networks, hosts, groups and services once, then search traffic using that vocabulary.
Use the Flow Matrix to mark intended communications and expose sessions outside the model.
Query sessions with NFQL, enrich public destinations, and route useful detections to webhooks or Gotify.
The goal of the landing page is the goal of the product: help a security or network team see concrete value before a long deployment project starts.
Sessions are checked against Tor and FireHOL sources so suspicious destinations are visible with source, time and context.
Unexpected east-west sessions stand out when they do not match the connectivity model you defined.
Public destinations are enriched with cloud, country and autonomous-system context so outliers are easier to explain.
Observed traffic proposes networks and hosts that can be added to the cartography instead of staying as shadow infrastructure.
Query recent sessions, compare them to rules, and keep the useful checks as alerts for the next occurrence.
Threshold and volume rules turn recurring patterns into alerts that can be sent to your existing notification path.
The product surface is built around the daily NDR workflow: understand the network, define what is expected, and investigate what falls outside it.
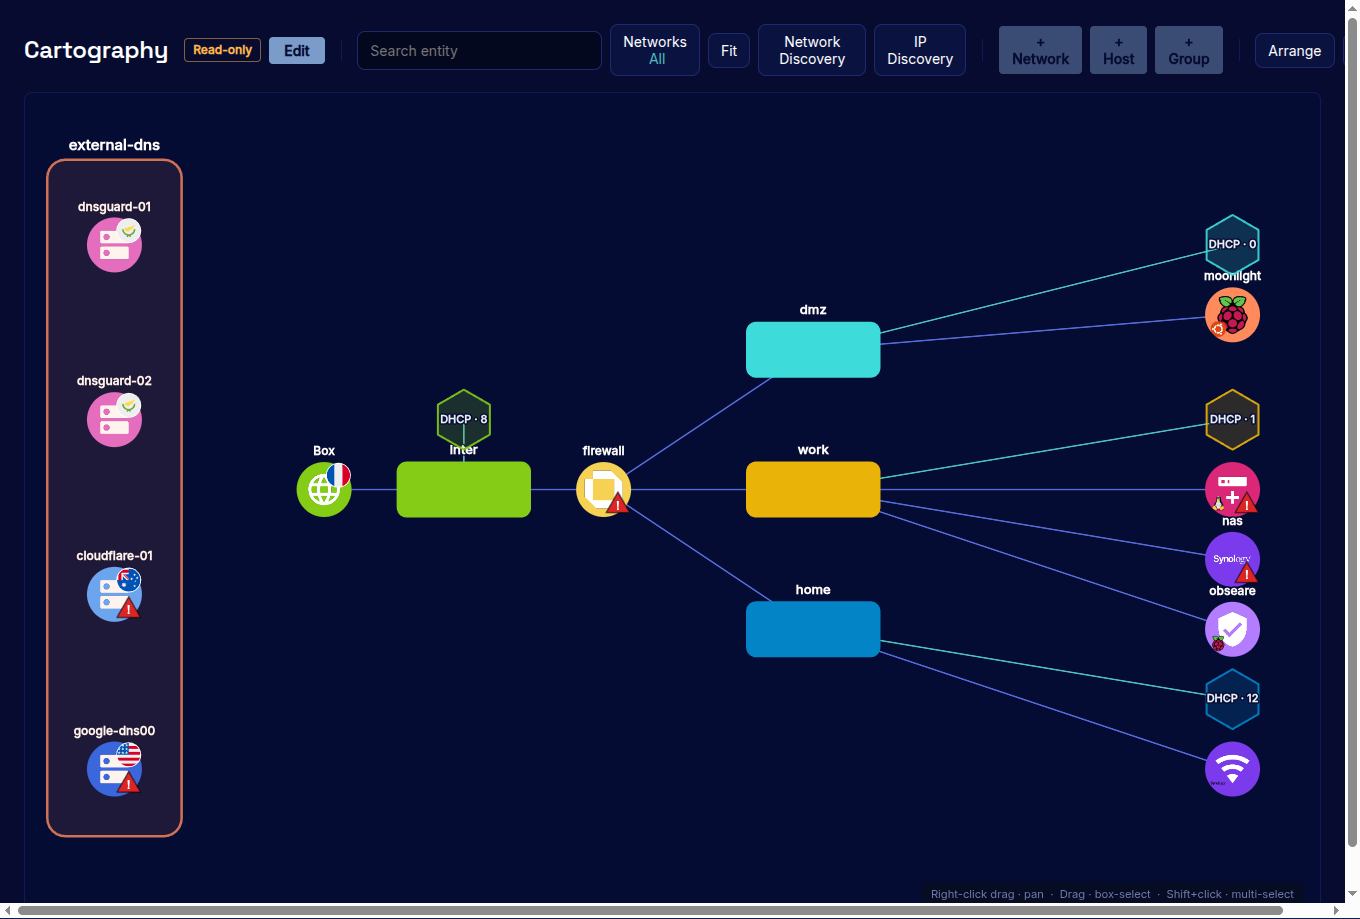
Explore hosts, groups, networks and services as a live graph. See traffic crossing every connection and discover devices that are not yet documented.
Learn more →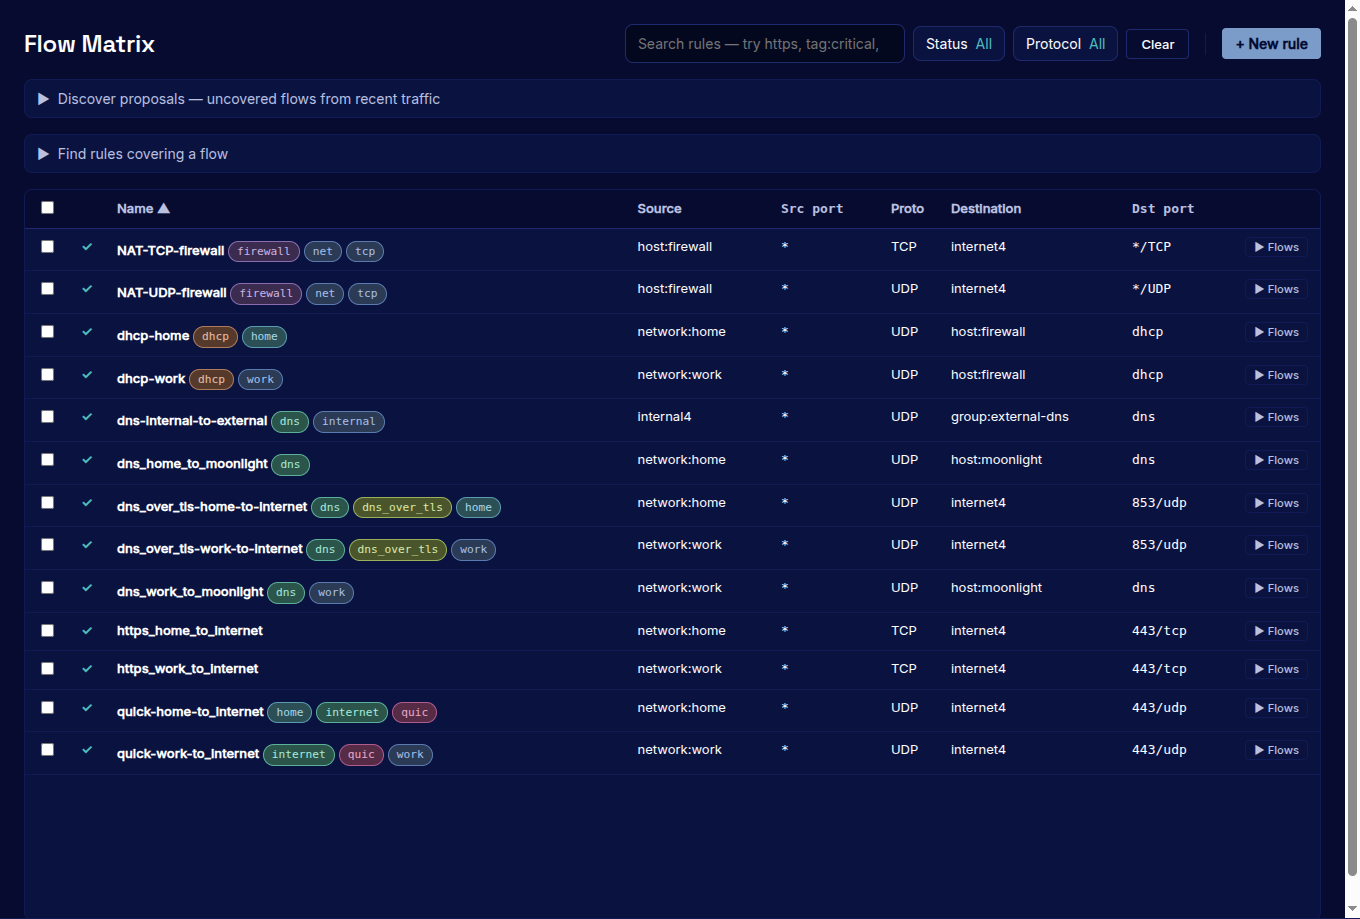
Define the communications your environment is expected to allow. obserae reveals sessions that fall outside that model.
Learn more →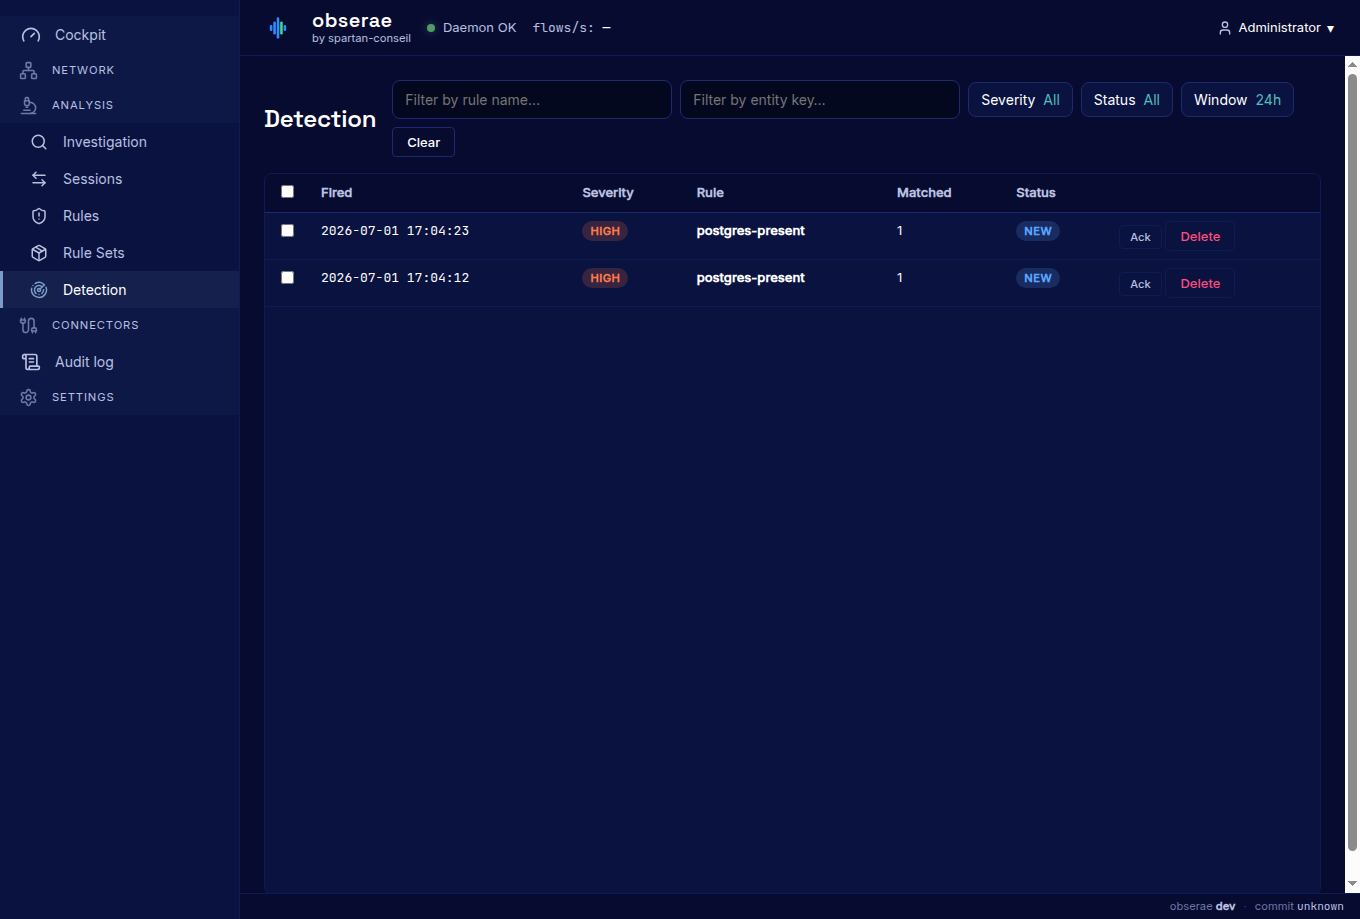
See raised alerts in one queue with severity, status, matching rule and sample rows. Acknowledge what is being handled and close what is resolved.
Learn more →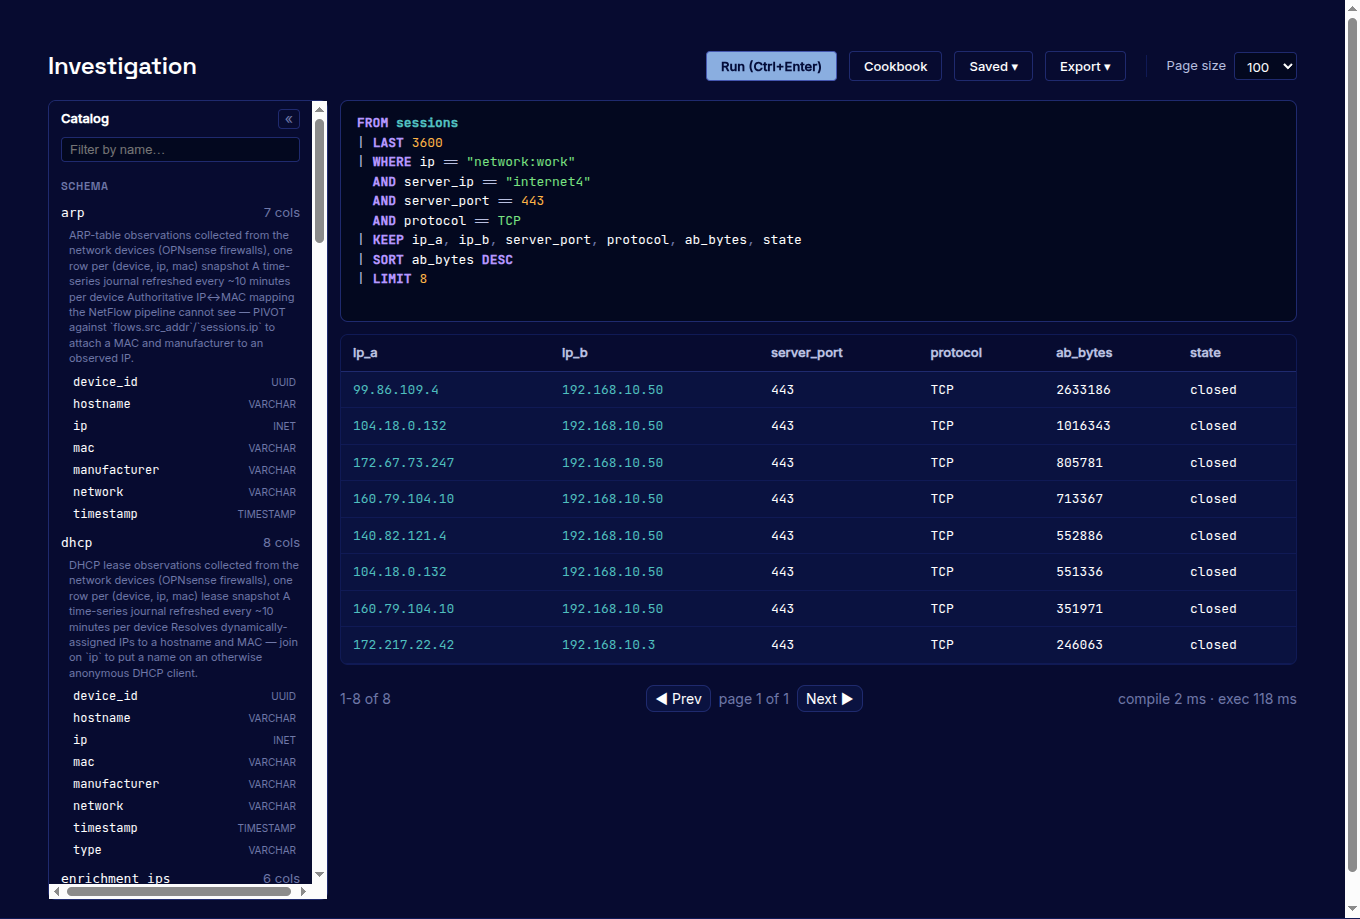
Investigate sessions and flows using names, groups, services, ports, protocols and available enrichment data. Save useful investigations as alerts.
Learn more →A useful NDR trial should not require forwarding packet captures to someone else's cloud. Start small, point one exporter at obserae, and look for the first unexplained conversations.
Self-hosted, offline-capable, signed releases, SBOM and provenance — traceable evidence to support NIS2, DORA and SOC 2 audits. The Community edition is free under the licence; larger deployments and future Enterprise features use commercial licences.
Start the Docker image or download a Linux release on amd64 or arm64.
docker run -p 2055:2055/udp -p 4739:4739/udp -p 127.0.0.1:8080:8080/tcp ghcr.io/spartan-conseil/obserae:latestPoint one router, firewall, virtual switch or host probe at UDP 2055/4739.
Name a few networks, key hosts and expected communications, then let discovery fill the gaps.
Use Cartography, Flow Matrix and Investigation to decide whether the signal is normal, misconfigured or suspicious.
Run it locally, follow the quickstart, and see whether the conversations match the network you think you operate.